
Fig. 2.
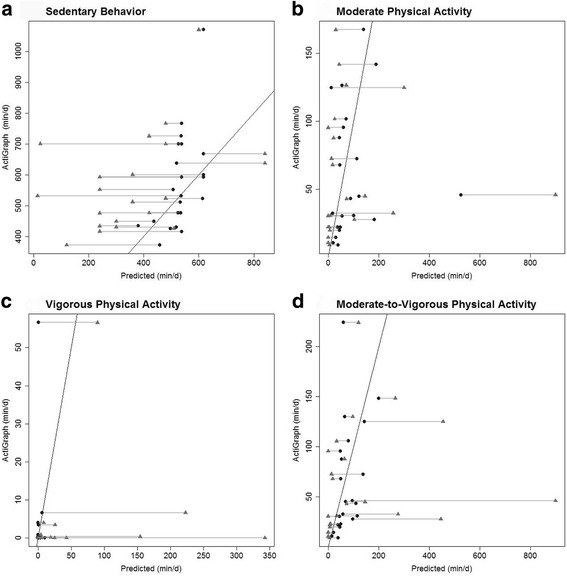
Global Physical Activity Questionnaire Reported, Model-Adjusted, and ActiGraph Measured Sedentary Behavior and Physical Activity. Triangles = raw GPAQ reported sedentary behavior and PA (min/d) plotted against ActiGraph measured sedentary behavior and PA (min/d)
Circles = model-adjusted sedentary behavior and PA (min/d) plotted against ActiGraph measured sedentary behavior and PA (min/d). Self-reported raw GPAQ values are connected to their corresponding model-adjusted GPAQ value with a horizontal line. Covariates include sedentary behavior, moderate-intensity PA, vigorous-intensity PA, MVPA, and age.