
Fig. 3.
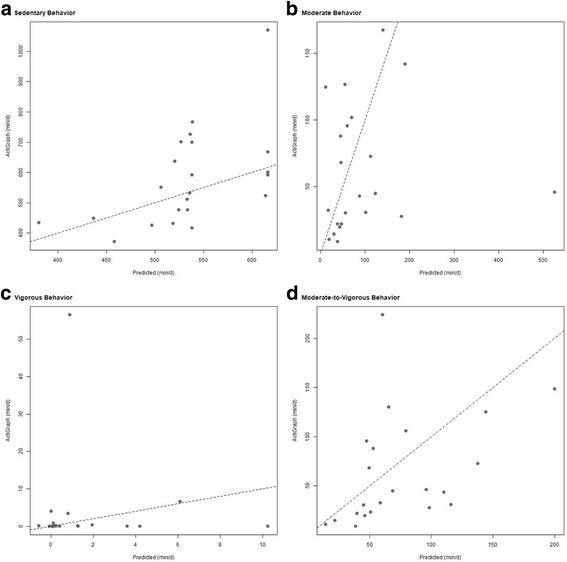
Model-Adjusted and ActiGraph Measured Sedentary Behavior and Physical Activity. Model-adjusted sedentary behavior and PA (min/d) plotted against ActiGraph measured sedentary behavior and PA (min/d)
Official websites use .gov
A
.gov website belongs to an official
government organization in the United States.
Secure .gov websites use HTTPS
A lock (
) or https:// means you've safely
connected to the .gov website. Share sensitive
information only on official, secure websites.
Model-Adjusted and ActiGraph Measured Sedentary Behavior and Physical Activity. Model-adjusted sedentary behavior and PA (min/d) plotted against ActiGraph measured sedentary behavior and PA (min/d)