. 2017 Nov 16;9(4):841–849. doi: 10.1039/c7sc03712k

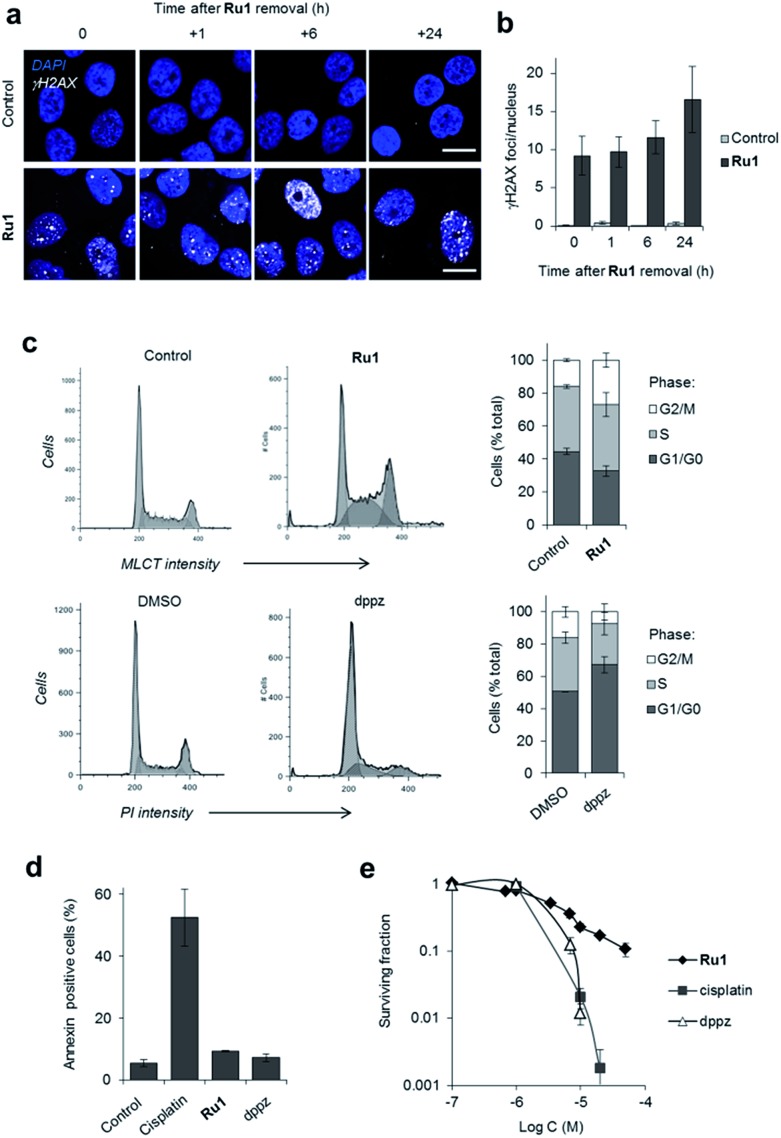
Fig. 3. (a) Representative CLSM images of OE21 cells treated with Ru1 (20 μM, 24 h) visualised at 0, 1, 6 and 24 h after complex removal. Immunofluorescence staining with anti-γH2AX antibody (white) provides visualisation of DSB damage. DNA (DAPI) staining included for reference. Scale bars = 20 μm. (b) Quantification of γH2AX foci/nucleus for OE21 cells treated as in (a). Data mean ± S.D. of four or five micrographs where a minimum of 20 nuclei were counted per image. (c) Impact of Ru1 (20 μM, 24 h) or dppz (7 μM, 24 h) on cell-cycle distribution of OE21 cells, as determined by flow cytometric analysis of DNA content. DNA content in Ru1-treated cells was quantified using the MLCT emission of Ru1 (see Experimental section). Data are mean of three independent experiments ± S.D. (d) AnnexinV staining of OE21 cells treated with cisplatin (23 μM), Ru1 (21 μM) or dppz (7 μM) for 24 h, as determined by flow cytometry. Average of two independent experiments ± S.D. (e) Clonogenic survival of OE21 cells treated with Ru1, cisplatin or dppz (24 h incubation time). Average of triplicates ± S.D.

Fig. 3