. 2017 Nov 16;9(4):841–849. doi: 10.1039/c7sc03712k

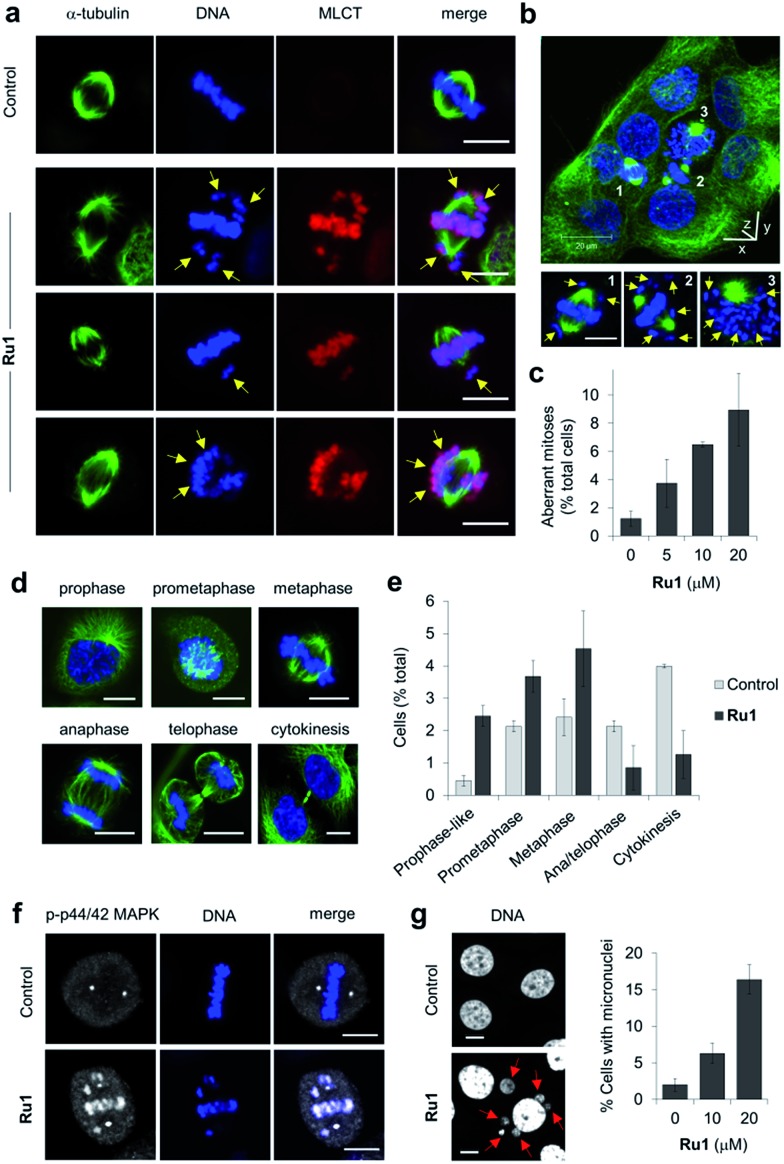
Fig. 4. (a) Misaligned metaphase chromosomes (yellow arrows) in OE21 cells treated with Ru1 (20 μM, 4 h). After fixation, cells were stained for α-tubulin (green) and DNA (DAPI, blue). MLCT (metal to ligand charge-transfer) emission of Ru1 included. (b) 3D representation of Ru1-treated OE21 cells (20 μM, 24 h) prepared from z-stack images. Non-aligned chromosomes in labelled cells shown by yellow arrows. (c) Quantification of aberrant mitoses in Ru1-treated OE21 cells (24 h). Data average of two independent experiments ± S.D., >200 cells were counted for each condition. (d) CLSM images of mitotic stages of OE21 cells. (e) Quantification of mitotic sub-populations in Ru1-treated OE21 cells (20 μM, 24 h). Data are expressed as a percentage of total cell population. Data average of two independent experiments ± S.D., >200 cells counted per experiment. (f) Localisation of phospho(p)-p44/p42 MAP kinase in metaphase OE21 cells treated with Ru1 (20 μM, 24 h), as determined by immunofluorescence (AlexaFluor594, white). DNA staining (DAPI, blue) included for reference. (g) Formation of micronuclei (red arrows) in OE21 cells treated with Ru1 (20 μM, 24 h). Data average of two independent experiments ± S.D. where >100 cells were counted for each condition. Scale bars = 10 μm.

Fig. 4