
Fig. 3.
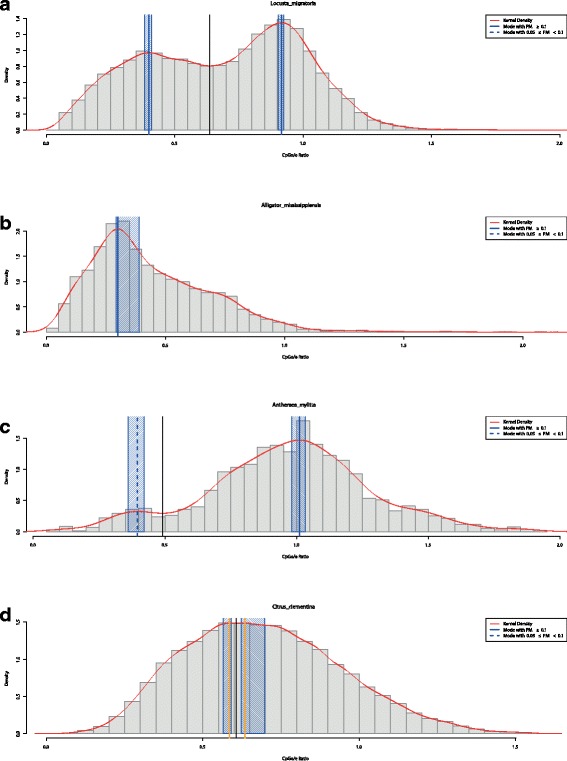
Step 2: kernel density estimation for samples of CpG o/e ratios from four species. The red line corresponds to the density estimated via KDE. Full vertical blue lines indicate modes with PM ≥ 0.1. Shaded blue areas around the modes correspond to bootstrap confidence intervals with a default level of 95%. From top to bottom, the panels show results for Locusta migratoria (a), Alligator mississippiensis (b), Antheraea mylitta (c), and Citrus clementina (d)