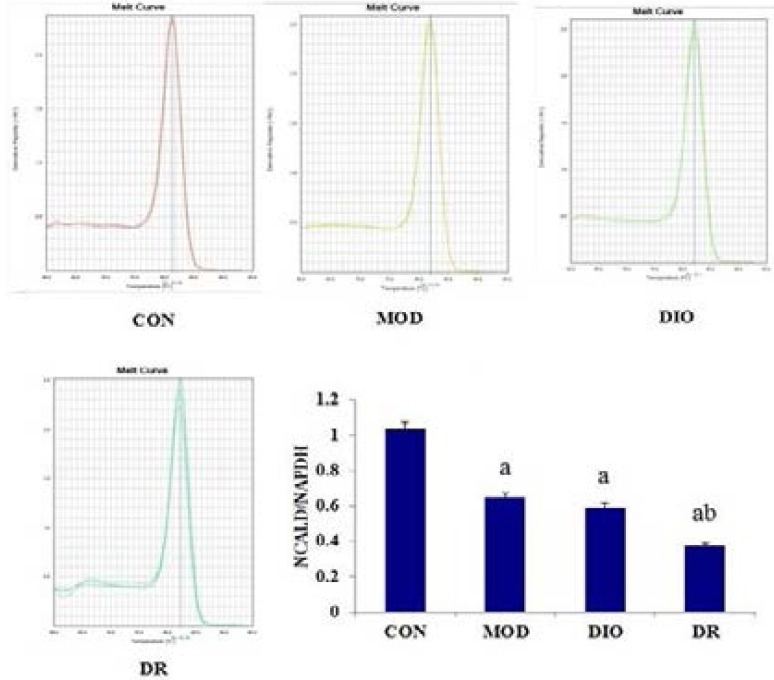
Figure 5.
The gene expression of NCALD in DIO and DR rats induced by HF diet. Mean values were significantly different from those of the CON group: a, p<0.05; Mean values were significantly different from those of the MOD group: b, p<0.05; CON, control; MOD, model rats with learning and memory impairment; DIO, diet-induced obese; DR, diet-resistant; NCALD, Neurocalcin-delta.

