Fig. 2.

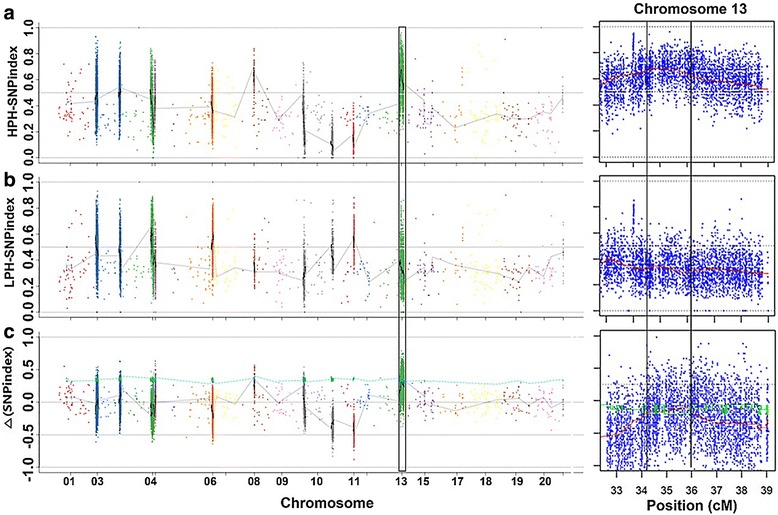
Identification of PH QTL qPH13.1 at the 34.20–35.93 Mb region on chromosome 13 by QTL-seq. a, b and c represent the single nucleotide polymorphism (SNP)-index plots of HPH-pool and LPH-pool, Δ (SNP-index) plot of 20 soybean chromosomes (left) and 32.5–39.0 Mb region on chromosome 13 (right), respectively, based on QTL-seq analysis. Y-axis represents the SNP-index calculated based on a 1 Mb interval with a 1 kb sliding window. The Δ (SNP-index) graph was plotted with statistical confidence intervals under the null hypothesis of no QTL (P < 0.05, blue and red), and one candidate major genomic interval (34.20–35.93 Mb) (marked by one rectangle in the left and bordered by two vertical black lines in the right) harboring a PH QTL (qPH13.1) was defined using the criteria of SNP-index near to 1 and 0 in HPH and LPH, respectively
