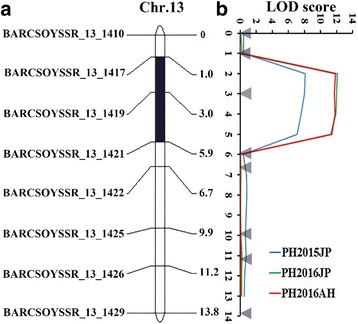
Fig. 3.

Validation of PH QTLs detected by QTL-seq through linkage mapping. a represents the linkage map of the target region detected by QTL-seq constructed by the Join Map v4.0 software, and b represents the distribution of the LOD scores for plant height over the target region detected by QTL-seq on chromosome 13. LOD scores were calculated independently by ICIM for the three environments. The LOD score for 2015NJ is in blue, 2016NJ is in green, and 2016AH is in red
