Fig. 3.

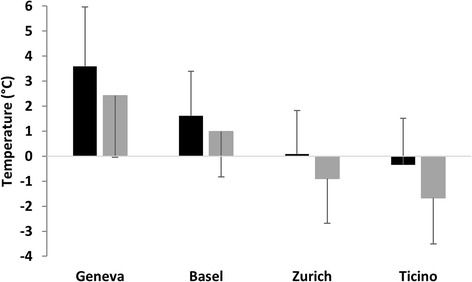
Mean January temperatures (black columns) and average January minimum temperatures (grey columns) in all catch basins south (Ticino) and north (Basel, Geneva and Zurich) of the Alps. Standard deviations are represented by black bars

Mean January temperatures (black columns) and average January minimum temperatures (grey columns) in all catch basins south (Ticino) and north (Basel, Geneva and Zurich) of the Alps. Standard deviations are represented by black bars