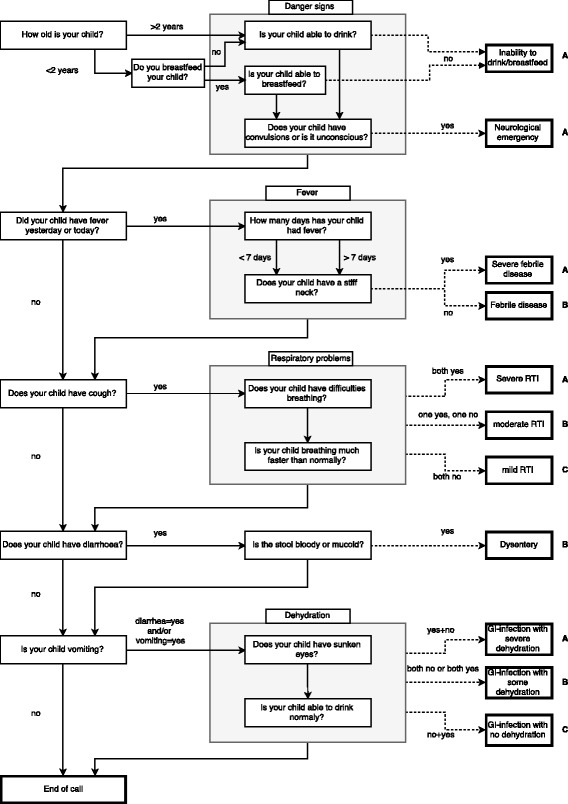
Fig. 1.

Flowchart of the clinical algorithm. Solid arrows show the flow from question to question. Unless otherwise indicated (e.g. arrow marked with “yes”), the next question was asked irrespective of the answer to the previous question. Dashed arrows indicate the disease assessments (shown in double framed boxes) resulting from answers to specific questions. Each disease assessment is associated with a treatment recommendation, indicated as either A (requiring emergency treatment), B (requiring causal treatment), or C (requiring home care). Grey boxes indicate contextually related questions (e.g. all questions relating to respiratory problems)
