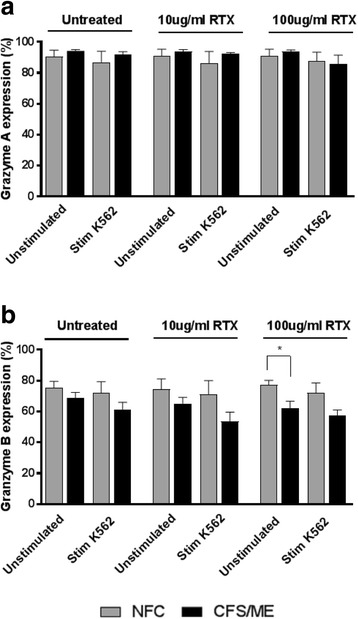
Fig. 3.

Natural killer cell lytic proteins. Bar graph plots representing in vitro assessment of NK cell lytic proteins. Data is represented as either unstimulated or stimulated with K562 target cells, and treated or untreated with RTX. (a) granzyme A and (b) granzyme B. Data is represented as the percentage of intracellular lytic proteins on the y-axis. Data presented as mean ± standard deviation. * refers to significant difference where p < 0.05. Abbreviations: CFS, chronic fatigue syndrome; Stim, stimulated; RTX, Rituximab; NFC, non-fatigued controls; ME, myalgic encephalomyelitis
