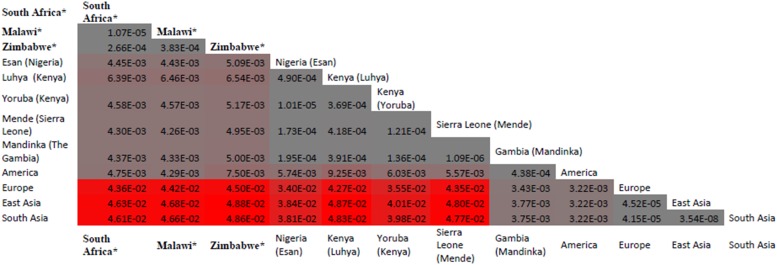
Fig. 3.
Distribution of frequency differentiation of targeted SNPs rs8176703; rs372091 and rs2334880 across various African populations. When comparing the measure of frequency differentiation among the genotyped SNPs and the corresponding frequencies of these SNPs in the 1000Genomes data, the frequency of the genotyped SNPs were highest among the Southern African populations and the African populations (Esan, Luhya, Yoruba, Mende and Mandinka) (Fig. 3). The frequencies were lowest between American, Asian and European populations. * Populations studied in from the current paper (South Africa, Zimbabwe and Malawi); other data were extracted from the 1000G project. The values provided are F-statistics calculated between each MAF for the three SNPs (rs8176703; rs372091 and rs2334880) and colored coded grey (genetically proximal) to red (genetically distal). Populations with less genetic distance have lower F-st and shown in grey whereas populations with greater genetic distance have higher F-st and are shown in red.

