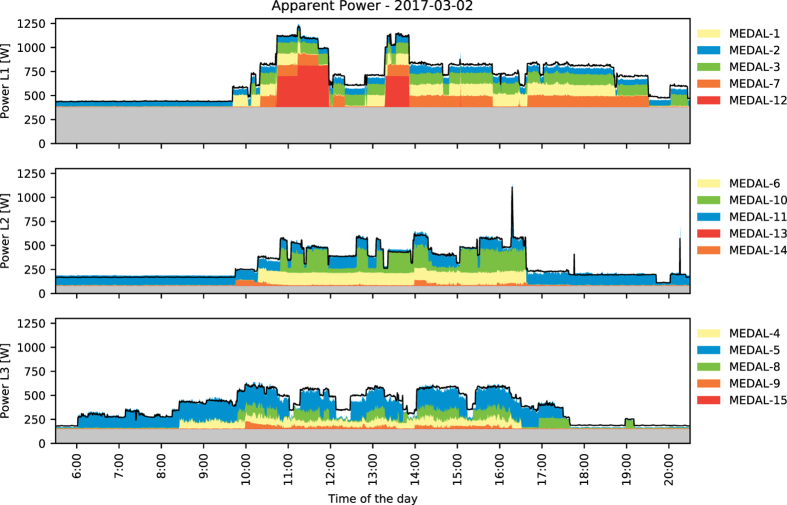
Figure 5. The load profile over multiple hours of the BLOND environment on 2017-03-02.
Each stack plot shows the apparent power consumption of CLEAR (black line) with overlays for the contained MEDAL sub-meters (colored areas). See Table 5 for the circuit mapping. The individual steps (appliance events) match the overall load profile of the aggregate EEC. Each circuit shows a base load (gray area) which accounts for static background consumers. The 1-second data summary was downsampled to 30 s before plotting. Total consumption stays constant in the hours not shown. For visualization purposes, only the sum of all MEDAL sockets was plotted, however, the data contains an appliance-specific breakdown.

