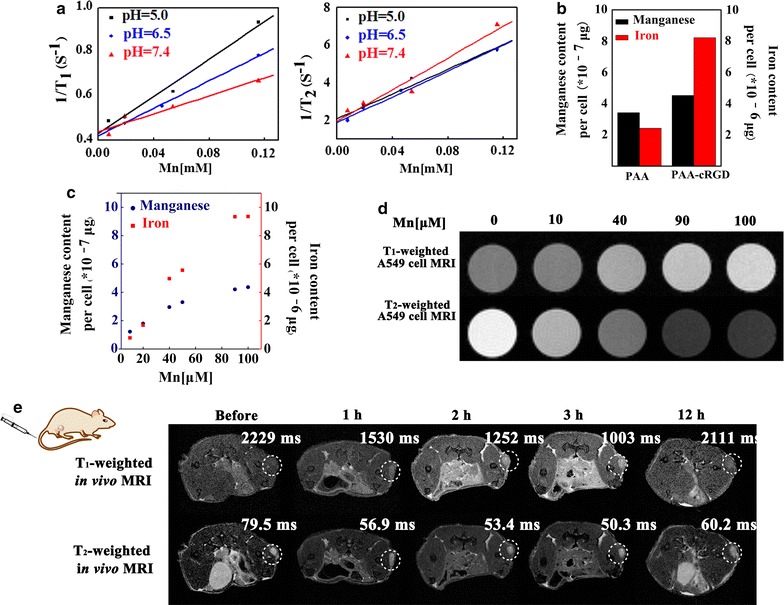
Fig. 4.

Relaxivity measurements and cell metal content determination of Mn-IOSP NCs: a the longitudinal relaxivity and transverse relaxivity of Mn-IOSP NCs at different pH (5.0, 6.5, 7.4), plots for 1/T1 and 1/T2 vs. Mn concentration, b iron and manganese content in A549 cells due to the uptake of NCs which modified with PAA-cRGD or PAA, c iron and manganese content in A549 cells due to the uptake of Mn-IOSPs in different concentrations, d T1- and T2-weighted MRI for A549 cells incubated with Mn-IOSP NCs at different concentrations, e in vivo T1- and T2-weighted MRI acquired before and after i.v. injection of Mn-IOSP NCs, the tumor sites were circled roughly with white dotted lines
