Fig. 3.

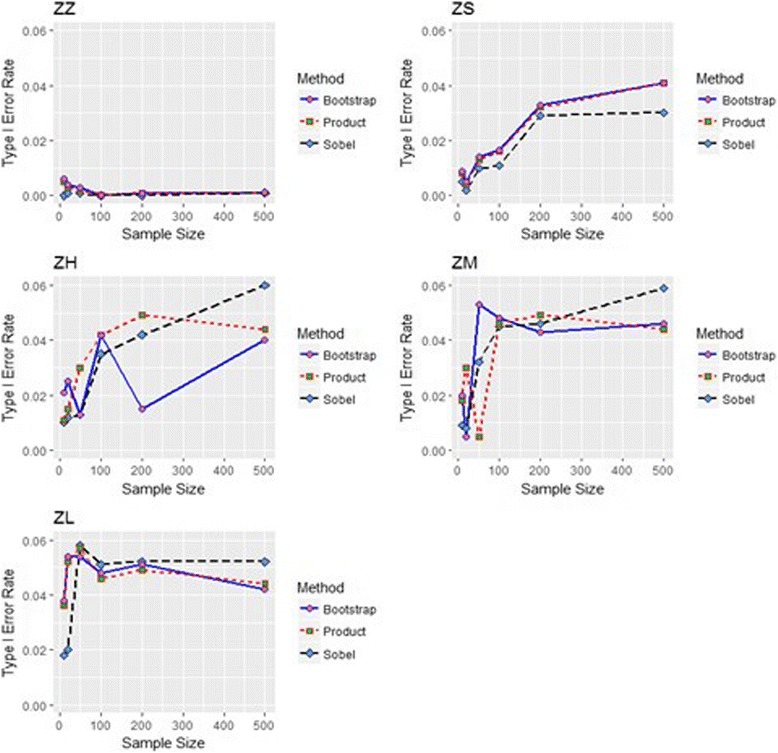
Type I error rates of Sobel’s (black line), distribution of the product (red line), and bootstrap (blue line) methods under various sample sizes with 3 repeated measures and ICC of 0.3

Type I error rates of Sobel’s (black line), distribution of the product (red line), and bootstrap (blue line) methods under various sample sizes with 3 repeated measures and ICC of 0.3