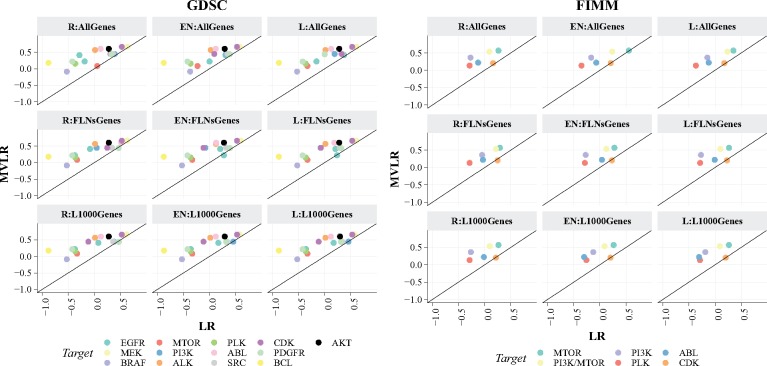
Fig. 3.
Spearman correlations on individual drug groups colored according to their primary target, computed across cell lines. Left: GDSC dataset, Right: FIMM dataset. Table 2 explains the method abbreviations. The predictive performance obtained by MVLR (shown on y-axis) for both datasets is found to be significantly higher than the others shown on x-axis (P <0.05; one-sided paired Wilcoxon signed-rank test corrected for multiple testing). Here, negative correlations correspond to poor performance as the baseline performance is –1, which is obtained using the mean of the training drug response data as predictions for the test sample

