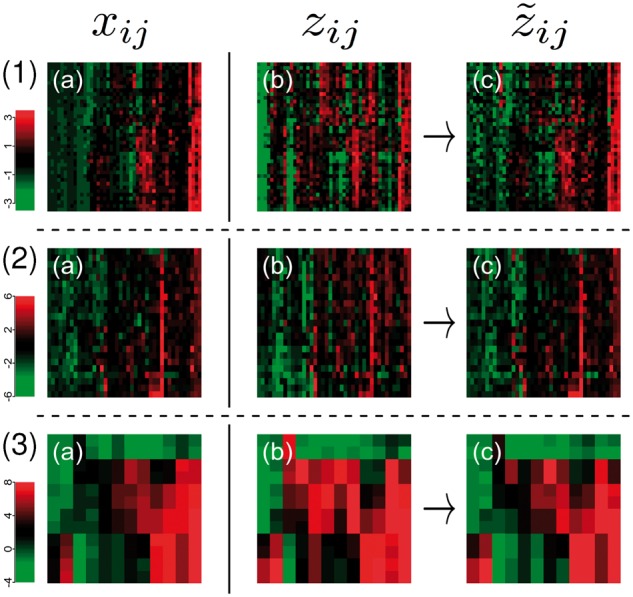
Fig. 1.

Comparison and adjustment of omics data of the same samples profiled with different technologies and protocols. The first two columns contrast state of the art normalized datasets. Row (1) shows paired gene expression data of the same non-Hodgkin lymphomas using the Affymetrix GeneChip (a) and NanoString nCounter (b) technology. Row (2) shows paired protein expression data acquired by SWATH (a) and SRM (b), for a subset of the non-Hodgkin lymphomas. And Row (3) shows paired expression levels of activated T cells for microarray (a) and RNA-Seq data (b). Column (c) shows heatmaps for the datasets (b) adjusted to match the datasets (a) using our model. Columns always correspond to molecular features (mRNA or protein) and rows to samples
