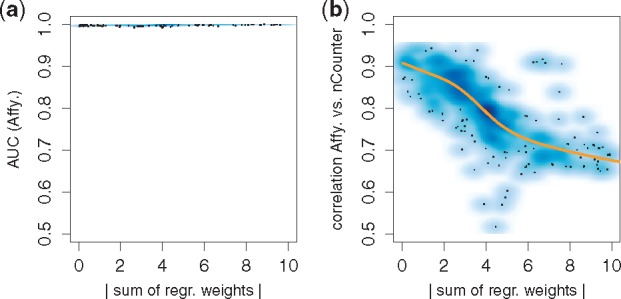
Fig. 3.

Comparing classifications across technologies: Plot (a) shows the absolute sum of regression weights for 1000 signatures trained on re-sampled data from technology 1 (Affymetrix) plotted against their classification performances (area under the receiver operating characteristic curve (AUC)) on independent data of the same technology. All signatures perform excellent independent of their strongly varying weights. The y-axis of Figure (b) shows the correlation (agreement) of classification scores for data of technology 1 (Affymetrix) and 2 (nanoString). Predictions from signatures with balanced weights (x-axis near zero) agree well across technologies, while unbalanced signatures produce conflicting predictions on the second technology
