
Fig. 3.
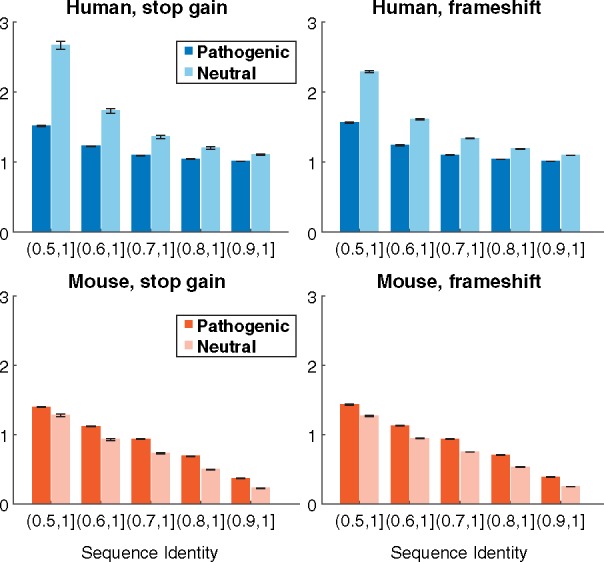
Homology profiles for the types of loss-of-function variants. Each plot shows the average number of sequences affected by pathogenic and putatively neutral variants, within a particular range of global sequence identity against human and mouse genomes