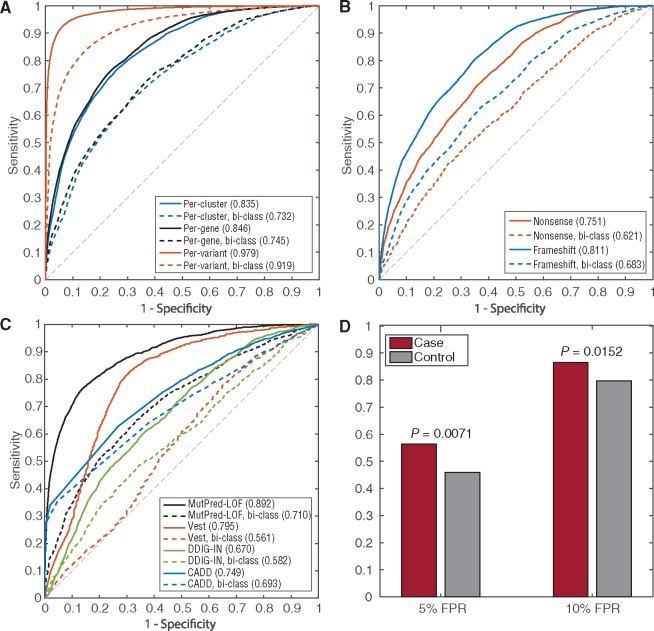
Fig. 4.
Receiver operating characteristic (ROC) curves and Areas Under the ROC Curves (AUC). (A) Cross-validation performance of MutPred-LOF with per-variant, per-protein, and per-cluster cross-validation; (B) Cross-validation performance of MutPred-LOF for frameshifting and stop gain variants separately; (C) The performance for other methods based upon the testing set. Black curves represent the performance of MutPred-LOFʹ. The dotted line represents performance of each model on the subset of variants from bi-class proteins; (D) Proportion of high-scoring de novo variants implicated in neurodevelopmental disorders in the case and control datasets based upon 5 and 10% false positive rate thresholds. The P-value derived from Fishers exact test is shown above

