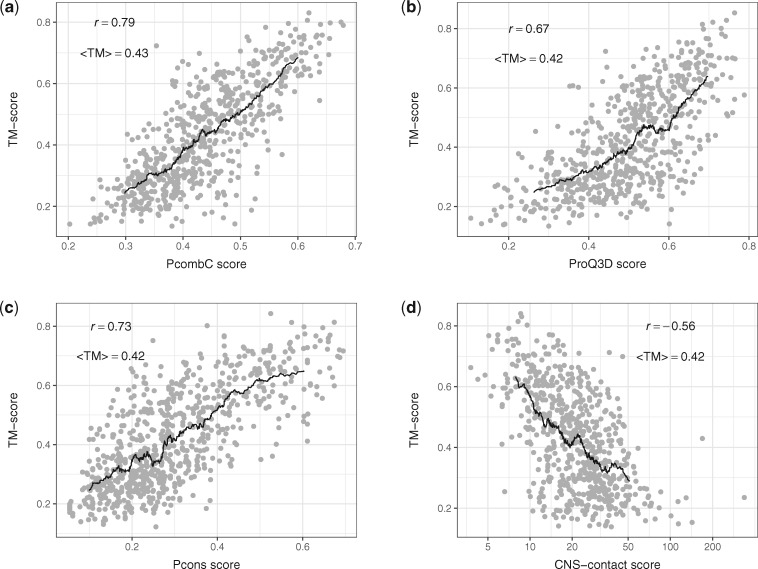
Fig. 4.
Model quality in TM-score on the benchmark dataset of the top-ranked models against (a) PcombC score (scoring function of the PconsFold2 pipeline), (b) ProQ3D score, (c) Pcons score and (d) and (d) CNS contact energy normalized by sequence length. Pearson correlations r and average TM-scores (<TM >) are shown, black lines represent moving averages with a window of 60 proteins. For CNS-contact, the Pearson correlation has been calculated on log10(CNS-contact)

