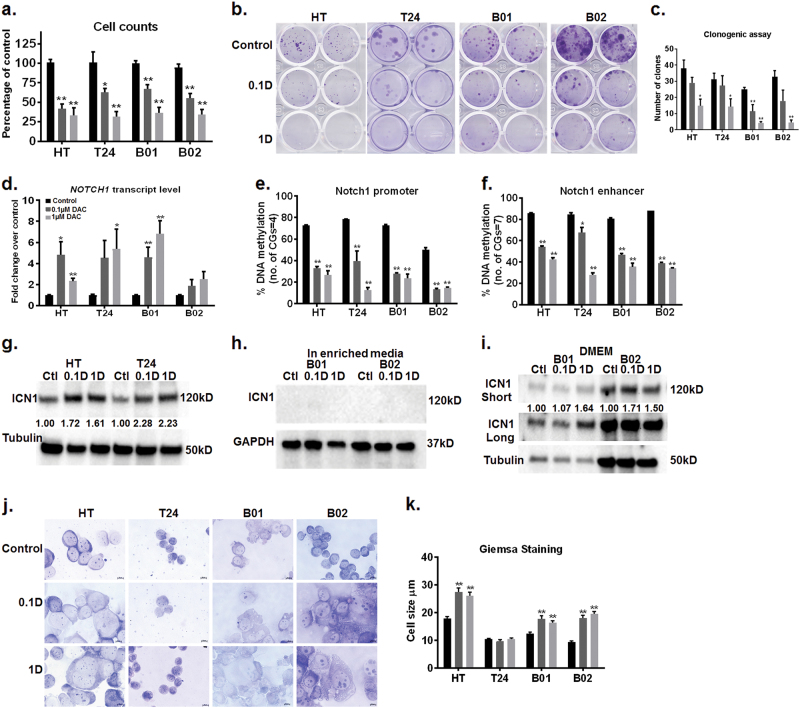
Fig. 1. DNA hypomethylation increases NOTCH1 expression and alters cell size.
Bladder tumor cells were treated with DAC every 48 h for up to 5 days. a 0.1 and 1 µM DAC caused a reduction in cell proliferation in all four bladder tumor cell lines. The Y axis represents percentage changes in cell counts in DAC-treated cells as compared to control cells. Error bars indicate standard error of means from triplicate experiments and technical duplicates in each experiment. b, c DAC treatment reduced the number of clones in bladder tumor cells lines. The number of clones were counted and compared to control cells. The Y axis represents the number of clones in control and treatment conditions. Error bars indicate standard error of means from triplicate experiments and technical duplicates. d DAC induced NOTCH1 transcript in bladder tumor cell lines. The Y axis represents fold change in DAC-treated cells as compared to control cells. Error bars indicate standard error of means from triplicate experiments and technical duplicates in each experiment. e, f DAC treatment decreased DNA methylation at the NOTCH1 promoter and enhancer regions. The Y-axis represents percentage DNA methylation with error bars indicating standard error of means from duplicate experiments and technical duplicates in each experiment. g, h Western blot analysis of DAC-treated bladder tumor cells showed an increase in the active intracellular domain of NOTCH1 (ICN1) in HT1376 and T24 but not in B01 and B02. GAPDH was used as the loading control. The western blot is a representative of triplicate experiments. i Western blot analysis of B01 and B02 cells cultured in DMEM showed an increase in levels of the active intracellular domain of NOTCH1, ICN1. GAPDH was used as the loading control. The western blot is a representative of triplicate experiments. j Bright field images of Giemsa staining showed morphological changes in DAC-treated cells. DAC-treated cells appeared enlarged and flattened as compared to control cells on Day 5. The images are representative of duplicate experiments. ________ represents 10 µm. k The horizontal length of 50 cells from each condition was measured by ImageJ. The graph represents an average measurement of 50 cells in control, and DAC-treated groups. The DAC-treated cells were significantly larger as compared to the control cells. Student’s t-test was used to compare control and treated cells in all the panels. *p < 0.05, **p < 0.01.

