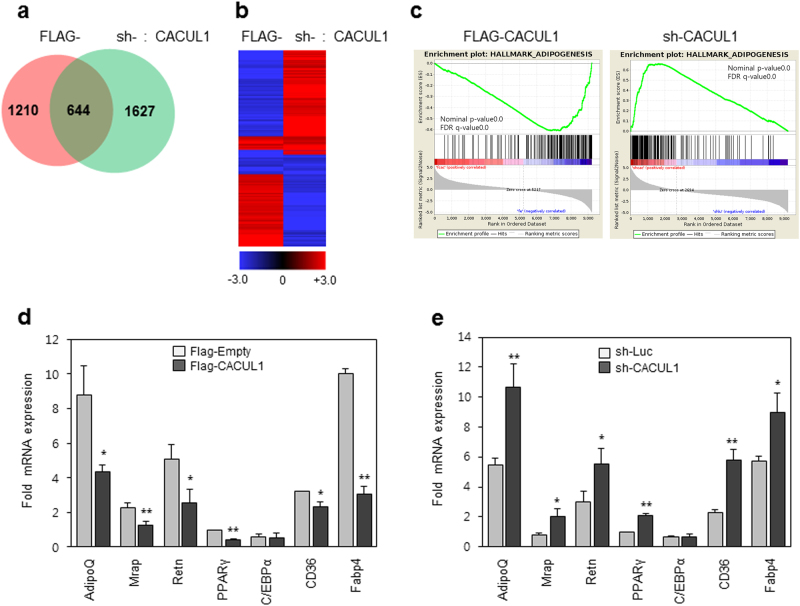
Fig. 6. Genome-wide analysis supports a critical role of CACUL1 in PPARγ signaling.
a Venn diagram of genes regulated by CACUL1. Stable 3T3-L1 cells with CACUL1 overexpression (FLAG-CACUL1) or knockdown (sh-CACUL1) were differentiated for 8 days and subjected to RNA-sequencing (RNA-seq). Genes with ≥2-fold expression changes were selected for each condition (FLAG-CACUL1, 1,854 genes; sh-CACUL1, 2,271 genes). b Clustering analysis. The 644 common genes were subjected to two-way hierarchical clustering. Data were satisfied with fc2 using Z-score for normalized values (log2 based). c Gene Set Enrichment Analysis (GSEA). One example associated with adipogenesis is shown. d, e Validation of RNA-seq data. Seven genes associated with adipogenesis and PPARγ signaling were selected and validated by RT-qPCR. Data indicate means±SD from three independent experiments. Fold mRNA expression was normalized to GAPDH expression (*P < 0.05, **P < 0.01)

