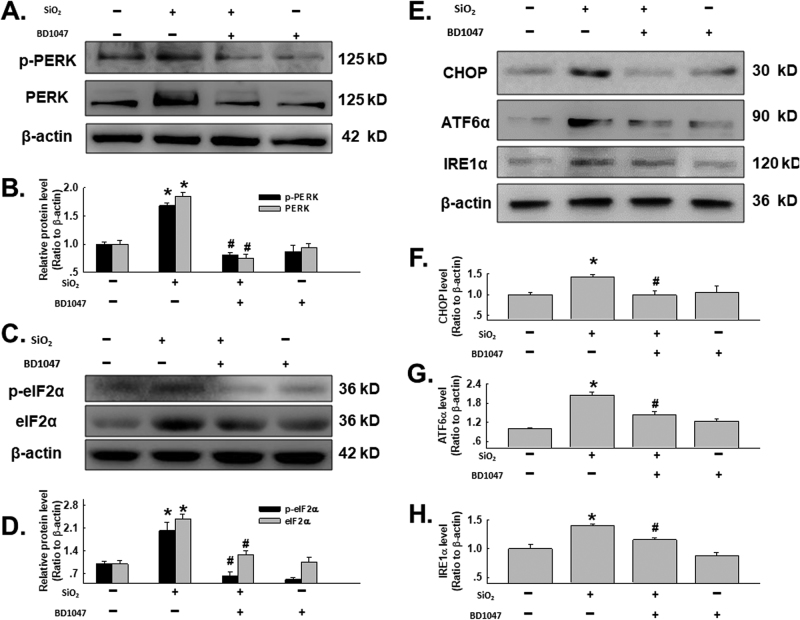
Fig. 4. σ-1R is involved in ERS induced by SiO2.
a Representative western blot depicting the effect of BD1047 on PERK phosphorylation. b Densitometric analysis of PERK and p-PERK protein expression levels from five independent experiments; *p < 0.05 vs the control group; # p < 0.05 vs the SiO2 group. c Representative western blot depicting the effect of BD1047 on eIF2α phosphorylation. d Densitometric analysis of eIF2α and p-eIF2α protein expression levels from five independent experiments; *p < 0.05 vs the control group; # p < 0.05 vs the SiO2 group. e Representative western blot depicting the effect of BD1047 on CHOP, ATF6α and IRE1α protein expression. Densitometric analysis of CHOP f, ATF6α g, and IRE1α h protein expression levels from five independent experiments; *p < 0.05 vs the control group; # p < 0.05 vs the SiO2 group

