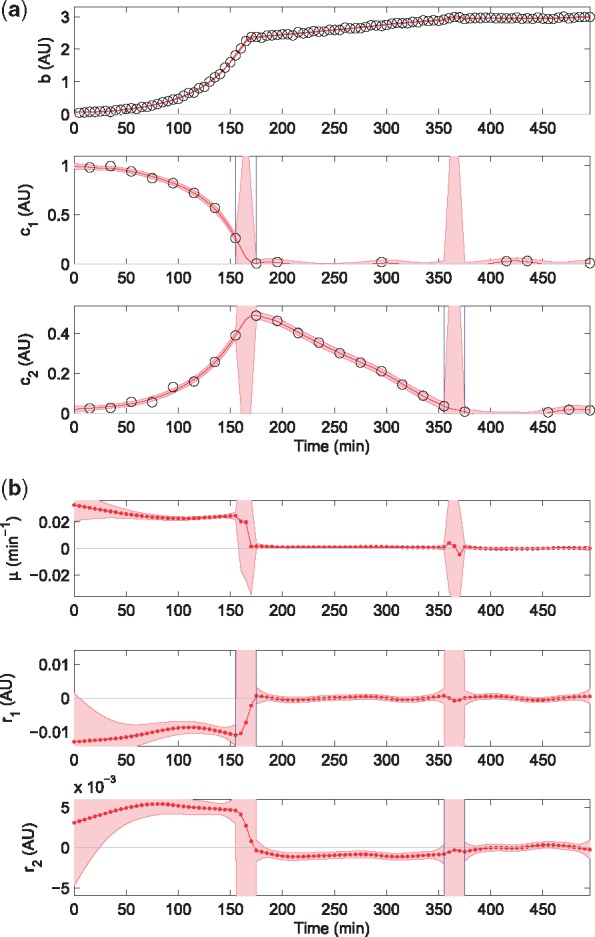
Fig. 2.

Estimation of exchange rates by applying the EKS method to a dataset obtained by simulating a diauxic growth experiment with overflow metabolism. Simulation parameters are reported in Supplementary Material Section S2.1, showing the simulated data and their confidence intervals. (a) Simulated data (circles), detected switching times (in-between vertical blue lines) when a substrate concentration drops to 0, and EKS estimates of biomass and concentration profiles with their 95% credibility intervals (red curves and bands, respectively). (b) EKS rate estimates from the fully automated procedure with 95% credibility intervals (red curves and bands, respectively)
