
Fig. 3.
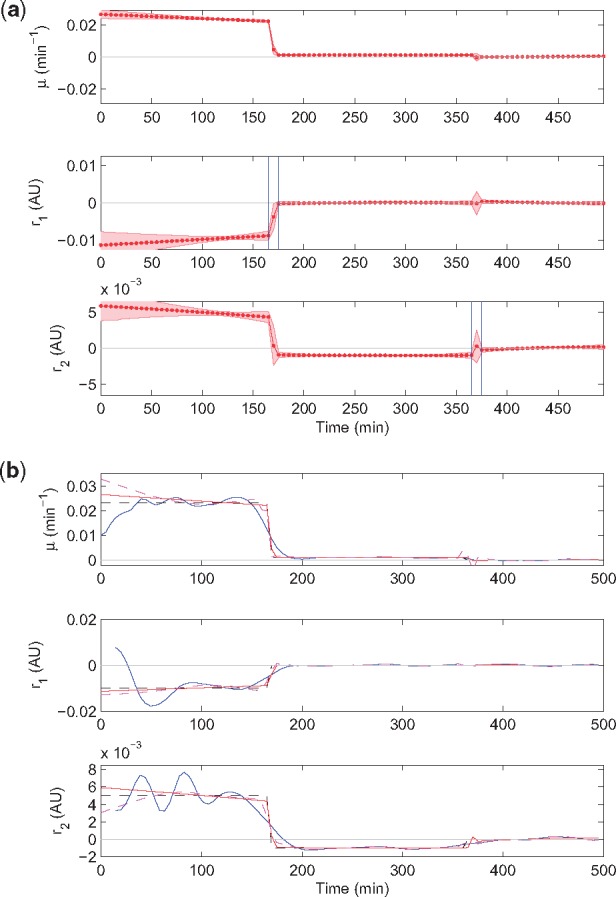
Comparison of the results obtained with different rate estimation methods applied to the data set of Figure 2. (a) EKS rate estimates and their 95% credibility intervals obtained after manual adjustment of the automatically determined switching periods and smoothing factors (red curves and bands, respectively). The adjustments concern a decrease of the length of the transition period to 10 min and a decrease of the smoothing factors to a uniform value of 10–6 for all i, with ratios unchanged. (b) Comparison of the true rates (dashed black curves) with estimated rates obtained by the spline smoothing method (solid blue curves), by the fully automated EKS method (same as in Fig. 2b; dashed magenta curves), and by a posteriori manual adjustment of the automatic EKS settings (solid red line)