
Fig. 4.
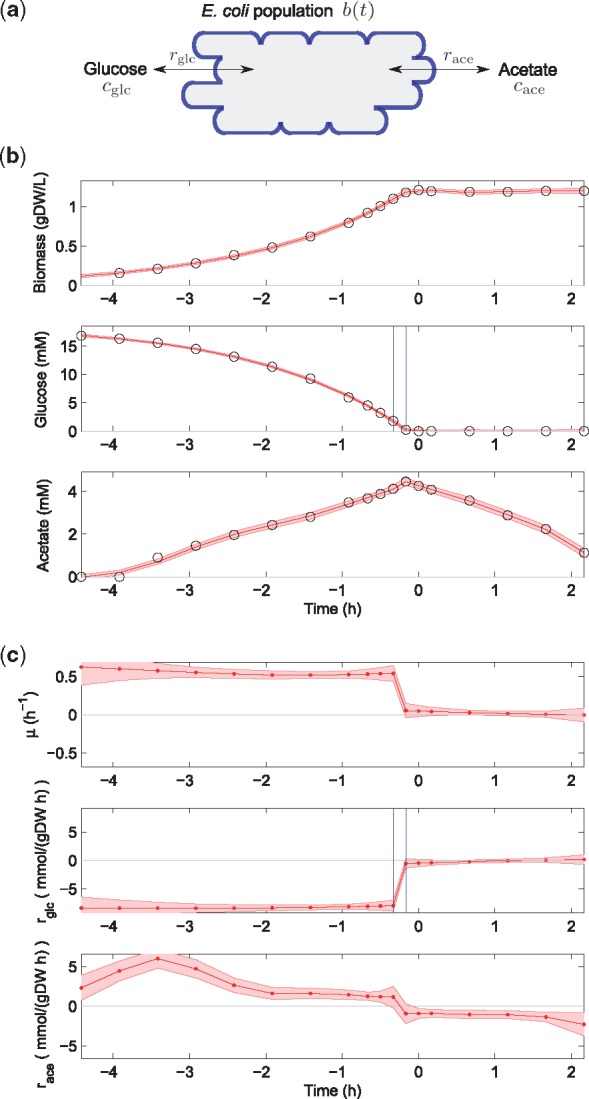
Diauxic growth on glucose and acetate of E. coli. (a) Model scheme defining variables and rates. (b) Data (circles) from Morin et al. (2016) and EKS estimates with credibility intervals (solid curve and shaded band) of biomass and concentration profiles. (c) EKS rate estimates and credibility intervals (red curve and shaded band) obtained with the fully automated procedure described in Section 3. The smoothing parameters found for biomass, glucose and acetate, and , were adjusted by a factor of and 2–1, respectively. For a comparison of the EKS estimates with the smoothing spline estimates, see Supplementary Material Section S2.2