
Fig. 5.
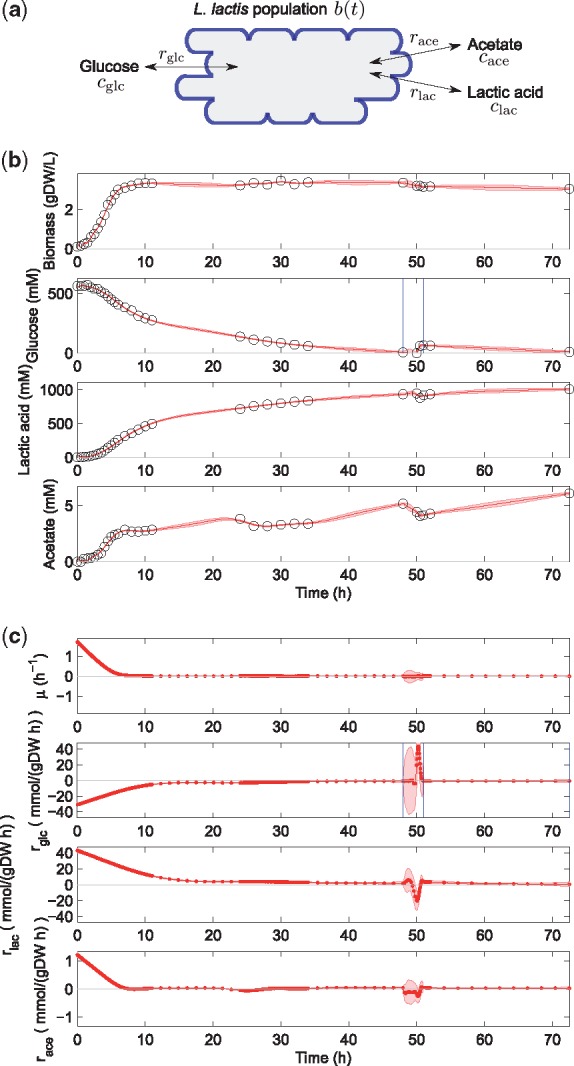
Lactic acid production by L. lactis. (a) Model scheme defining variables and rates. (b) Data (circles) and EKS estimates with credibility intervals (solid red curve and shaded band) of biomass and concentration profiles. The detected switching time lies between the two blue vertical lines. (c) EKS rate estimates and credibility intervals (red curve and shaded band) obtained with the fully automated procedure described in Section 3. The smoothing parameters used for biomass, glucose, lactic acid and acetate are and , respectively. Factors , as per default settings, except for , to cope with glucose addition