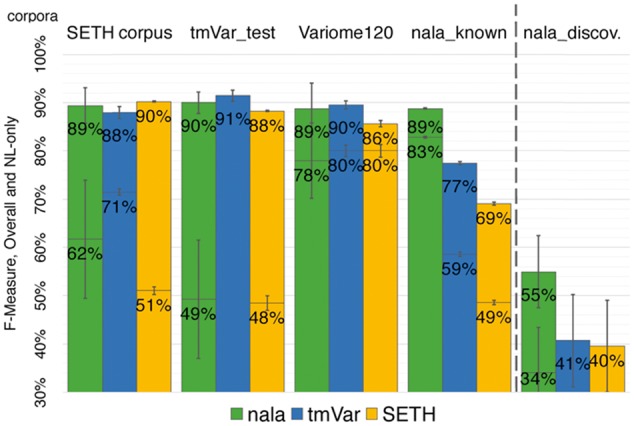
Fig. 3.

nala performed well for all corpora. The bars give two different results: values above the horizontal lines in bars reflect the F-measures for all mentions, while values below the horizontal lines in bars reflect the F-measures for the subset of NL-mentions in the corpus (high error bars indicate corpora with few NL mentions). The exception was the result for the method tmVar on the corpus tmVar_test, which was taken from the original publication of the method in which no result was reported for NL-only (Wei et al., 2013). That publication reports only exact matching performance, i.e. its overlapping performance might be higher than shown here. nala consistently matched or outperformed other top-of-the-line methods in well-indexed corpora (SetsKnown; left of dashed line) and substantially improved over the status quo in recent non-indexed discoveries (nala_discoveries; right of dashed line). The F-measures of tmVar and SETH for NL-only on nala_discoveries was essentially zero (two rightmost bars) (Color version of this figure is available at Bioinformatics online.)
