Fig. 4.

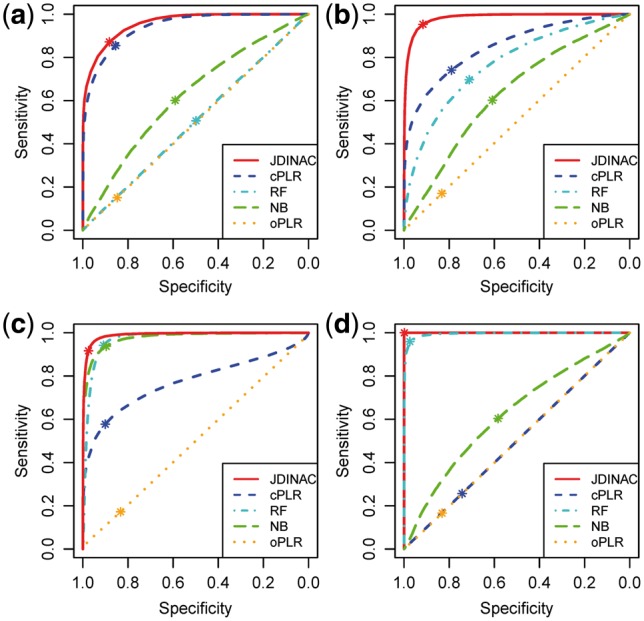
ROC curves of 5 methods for the classification under scenario 1 (a), scenario 2 (b), scenario 3 (c) and scenario 4 (d). The asterisk indicates the location where the cutoff of prediction was set to 0.5

ROC curves of 5 methods for the classification under scenario 1 (a), scenario 2 (b), scenario 3 (c) and scenario 4 (d). The asterisk indicates the location where the cutoff of prediction was set to 0.5