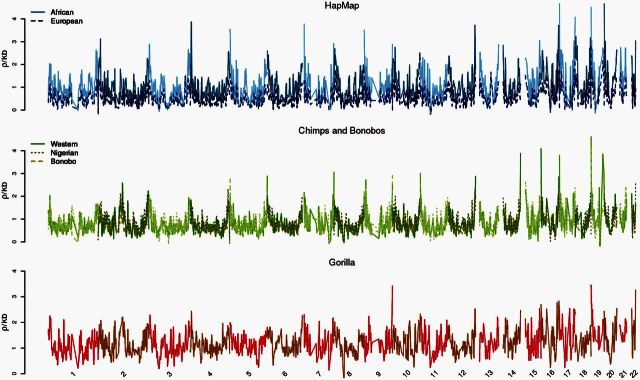
Fig. 1.
Broad-scale comparisons of recombination rates across great apes. Genome-wide plot of recombination rate estimates for Europe and African human populations from HapMap, western chimpanzees from PanMap, and the three maps generated here, grouped within humans (N = 2), chimpanzees and bonobos (N = 3), and gorillas (N = 1) to highlight both within- and between-species differences. Alternating chromosomes are plotted in different colors to emphasize boundaries.

