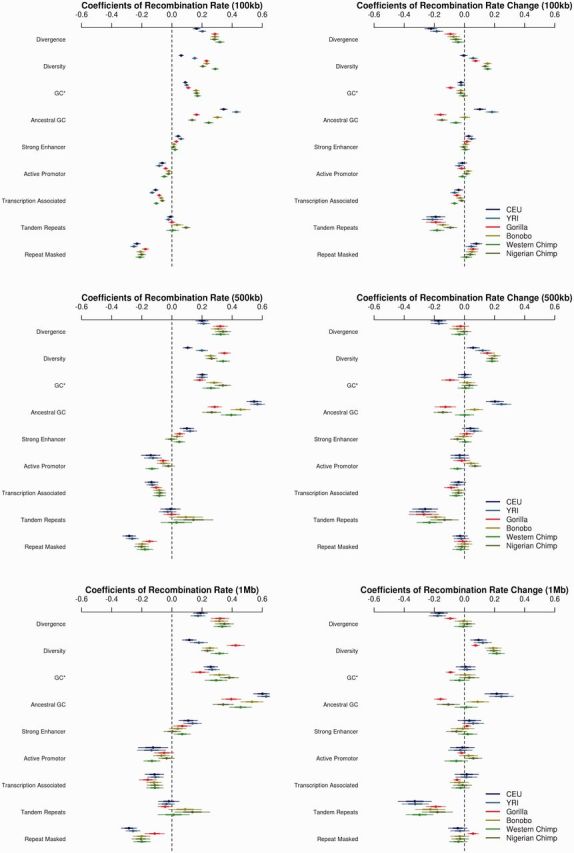
Fig. 5.

Genetic correlates of recombination rate. The predictors of recombination rate (left) and the change in recombination rate since the human–chimpanzee ancestor (right) at varying physical scales (top to bottom). Within each pane, multiple linear regression coefficient estimates (with standard errors, SEs) are shown for each of the independent variables across taxa. Larger coefficients reflect larger effects, while smaller SEs correspond to larger correlations.
