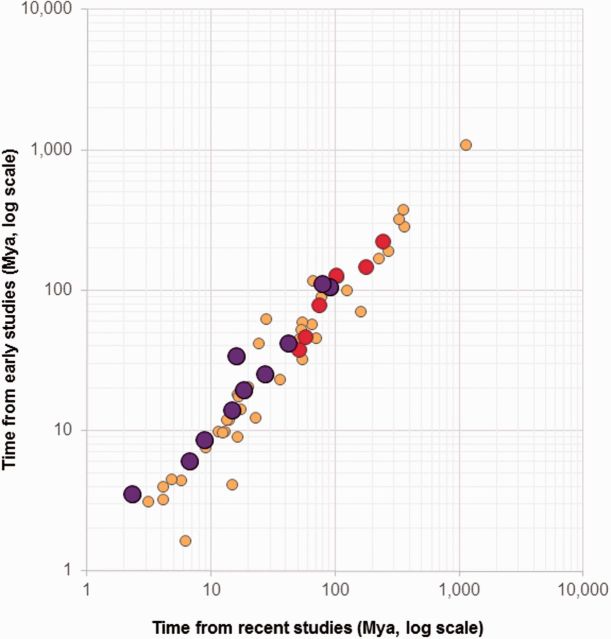
Fig. 3.
A comparison of divergence times published before year 2000 (second generation, early studies) and since year 2010 (third generation, recent studies). Divergence times in Hedges et al. (2015) were scanned to identify timetree nodes where at least two studies published before year 2,000 were available. Average divergence times from these studies are plotted on the y-axis (log-scale), and those reported in studies recently (≥2010) are on the y-axis (log scale). Regression analysis through the origin shows a linear trend with a slope of 0.997 for all points (r = 0.98). Average times from two (small yellow circles), three (medium red circles), and more (large purple circles) studies published before year 2000 are compared with those published more recently (≥2010) for the same nodes in the Hedges et al. (2015) timetree.

