
Fig. 1.
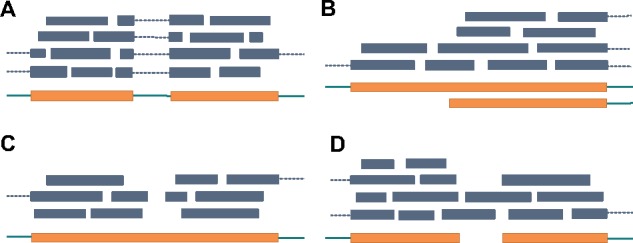
Illustration of identification of splicing junctions and challenging of identifying boundaries. Exons and introns are represented as thick orange bars and thin green bars, respectively. Reads are represented as blue bars, where spliced reads are connected with dotted lines. (a) Splicing junction can be inferred from a group of aligned spliced reads. (b) A transcript starts in the middle of an exon. In this case, we can observe an increasing of read coverage. TypicalRule shall fail to identify this boundary. (c) A gap appears in the middle of an exon. TypicalRule shall report two false-positive boundaries. (d) Two transcripts are bridges by reads. TypicalRule shall miss these two boundaries