
Fig. 5.
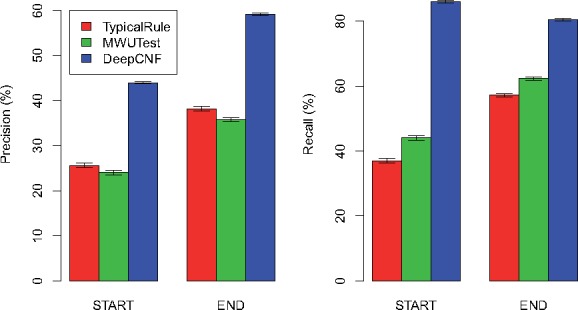
Comparison of the three methods on mouse simulations with each dataset containing 150 M reads. The height of each bar shows the average precision (left part) and recall (right part) over the 10 datasets, while the thin bar on top illustrates the standard deviation