
Fig. 1.
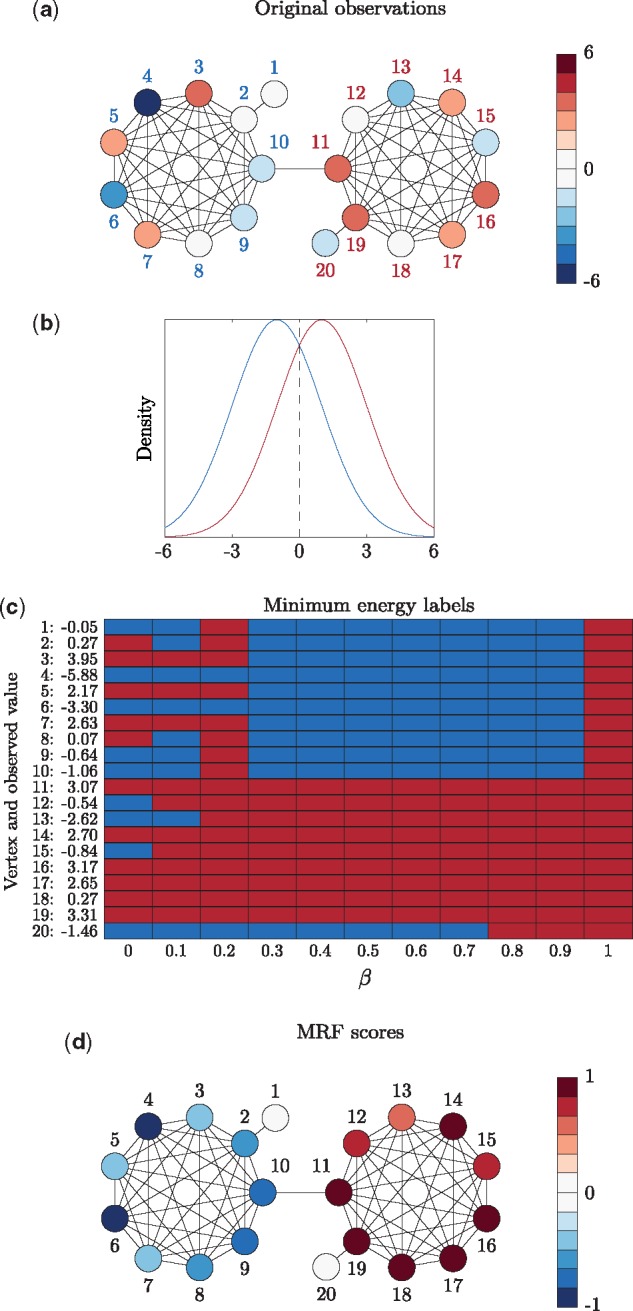
Toy example. (a) Original observations and underlying label (‘blue’ or ‘red’) for each vertex. The vertices on the left are true ‘blue’ vertices while the vertices on the right are true ‘red’ vertices, indicated in the vertex labels. The observed value for the vertex is indicated in the colour of the vertex itself. (b) Densities corresponding to both the ‘blue’ or ‘red’ labels. (c) Minimum energy labels for a range of values of β. (d) The MRF scores