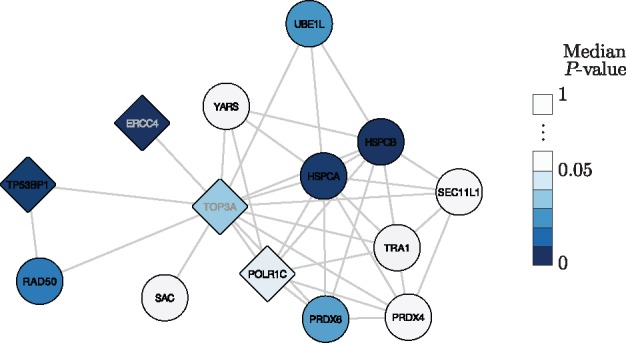
Fig. 4.

TOP3A and neighbours present in the top 200 MRF hits. Vertices are coloured based on median score/P-value. Diamond vertices correspond to the genes with the ‘nuclear lumen (GO:0031981)’ annotation. The network was visualized in Cytoscape 3.3.0 (Shannon et al., 2003) using the yFiles Organic layout
