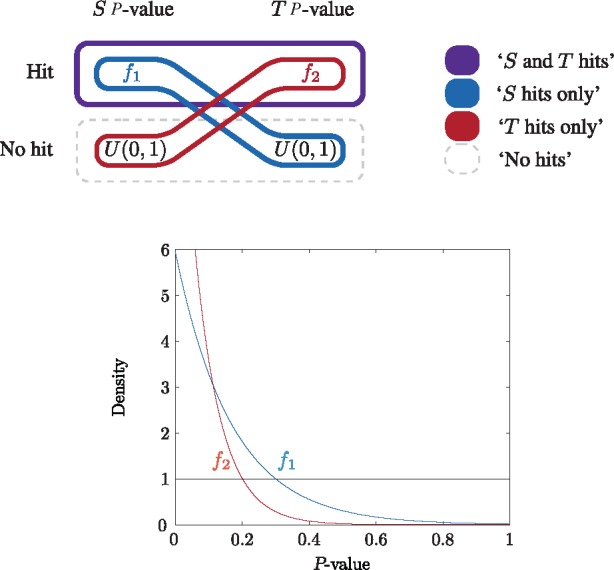
Fig. 5.

Schematic diagram of the construction of the bivariate densities corresponding to each label for the lymphoma data. In each dimension there are two possibilities and an associated univariate density: ‘non-hit’ (U(0, 1)) and ‘hit’ (). Bivariate densities are defined for each of four labels of interest and are schematically represented by encompassing a single possibility in each dimension. The four labels are: ‘S and T hits’ (low P-value in both dimensions), ‘S hits only’ (low P-value in S dimension), ‘T hits only’ (low P-value in T dimension) and ‘no hits’ (no low P-value in either dimension)
