Fig. 6.

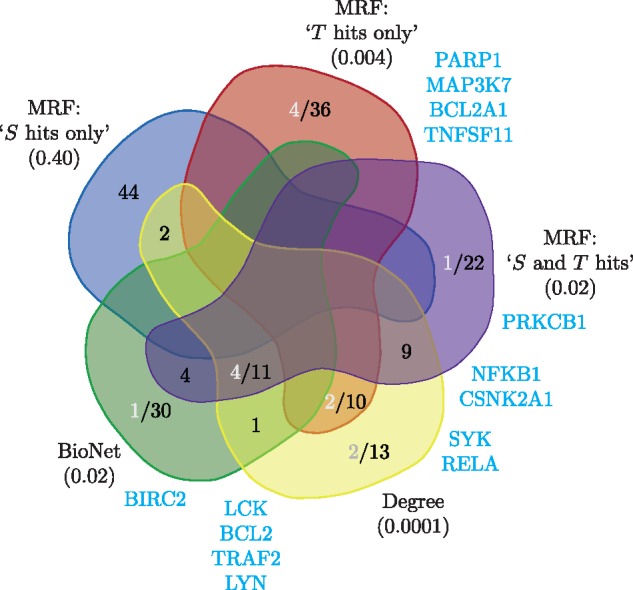
Venn diagram of the hit lists for the lymphoma data overlaid with genes associated with the NFκB pathway. There are 46 genes in each hit list (black) along with the genes associated with the NFκB pathway (grey and listed at the sides in blue). The NFκB annotation was obtained from KEGG (Kanehisa et al., 2016). Below each method is the P-value for the Fisher exact text for enrichment or depletion of the NFκB terms in the hit list. The Venn diagram is based on the layout from http://bioinformatics.psb.ugent.be/webtools/Venn/
