
Fig. 7.
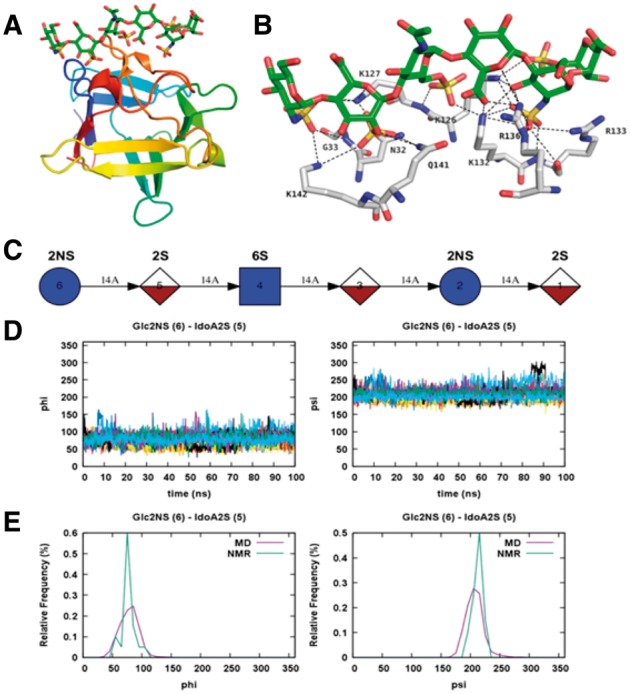
MD simulations of FGF-1 monomer with a heparin analogue. (A) FGF-1 monomer in complex with a heparin analogue in PDB ID: 2ERM. (B) The hydrogen bonds between the FGF-1 monomer and heparin analogue are shown by dotted lines. (C) Symbolic representation of the heparin analogue. (D) Time series of ϕ and ψ glycosidic angles between Glc2NS (residue 6 in C) and IdoA2S (residue 5 in C) obtained from the 100-ns MD simulations starting from 20 different initial NMR models. (E) Frequency distribution curves of ϕ and ψ angles obtained from the MD simulations in comparison with those calculated from the 20 NMR models