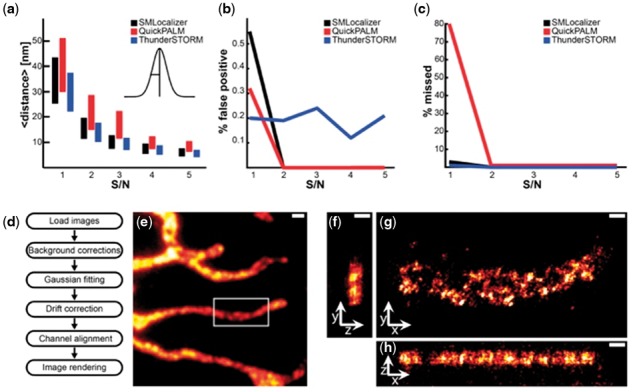
Fig. 1.

Quality control and comparison, architecture and 3 D example. Comparison of SMLocalizer, QuickPALM and ThunderSTORM using five datasets with increasing peak signal to peak noise ratio (S/N). (a) Mean distance from ground truth. Center of bars represent the mean distance and height of bars represent standard deviation of the sample. (b) False positive localizations. (c) Total missed true localizations. (d) The basic analysis workflow of SMLocalizer. (e) Widefield image of U2OS cells stained for mitochondrial Mitofilin with an Alexa-Fluor647 secondary antibody. Scale bar is 1 µm. (f–h) ZY (f), XY (g) and XZ (h) projection of SMLocalizer analyzed and rendered results of 3 D [PRILM (Baddeley et al., 2011)] imaging of the sample in e). Image is rendered with intensity representing binned localization densities that has subsequently been filtered using a 10 nm σ Gaussian. Scale bars are 250 nm (see Supplementary Methods)
