
Fig. 2.
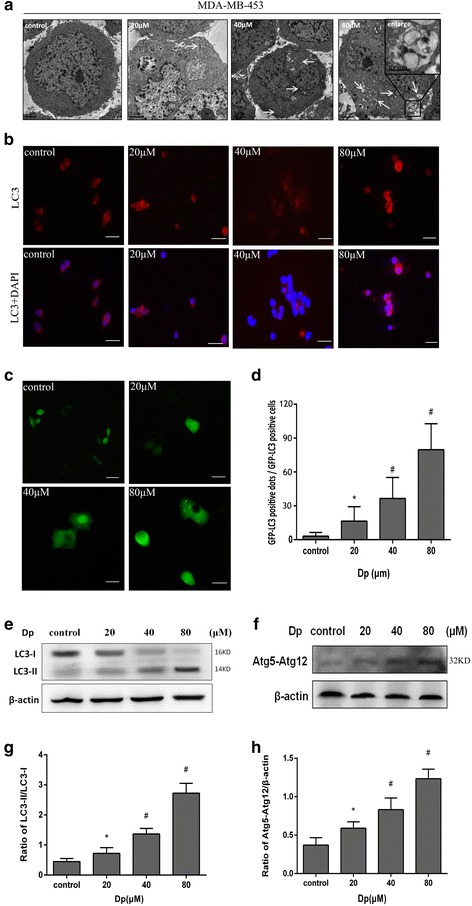
Delphinidin induced autophagy in MDA-MB-453 cells. a Representative transmission electron microscopic images of MDA-MB-453 cells treated with DMSO (0.1%) or delphinidin (20, 40, and 80 μM) for 48 h. Arrows: autophagic vacuoles. b LC3 immunofluorescence-positive dots in MDA-MB-453 cells (× 400). c Expression of GFP-LC3-positive punctate dot (× 400). d Statistical graph of GFP-LC3-positive dots. e Expression of the LC3-II protein. f Expression of the Atg5-Atg12 conjugated protein; (g): Statistical analysis of the LC3-II/LC3-I ratio. h Statistical analysis on the ratio of Atg5-Atg12/β-actin. Dp: Delphinidin. *P < 0.05 vs control group; #P < 0.05 vs Dp group