
Fig. 7.
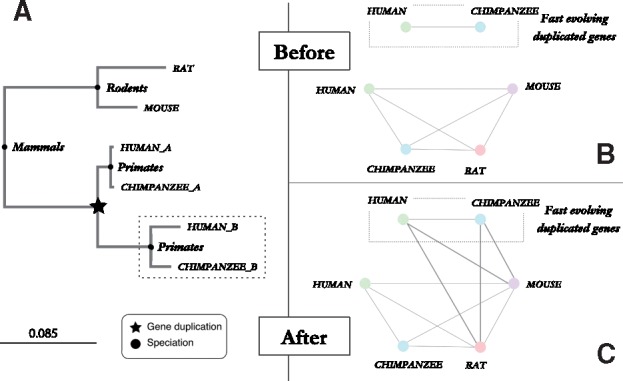
Analysis of haptoglobin gene family in mammals. (A) Phylogenetic labeled gene tree of the haptoglobin family built using 6 proteins sequences from 4 mammals (rat, mouse, human, chimpanzee). The dotted rectangle highlights the fast evolving primate paralogous genes. (B,C) Orthology graph of the haptoglobin gene family shown in A. Nodes represent extant genes denoted by a species-specific color and their identifier meanwhile the edges represent pairwise orthologous relations between genes. The orthology graph in B, relies on the pairwise orthologous relations inferred using the classic OMA algorithm, while the orthology graph in C is built using the orthology relations including the refinement for paralogs evolving at different rates. (UniProt IDs of the sequences involved Mouse→Q16646, Rat→A0A0H2UHM3, Human_a→HOY300, Chimpanzee_a→H2RAT6, Human_b→P00739, Chimpanzee_b→H2RB63)