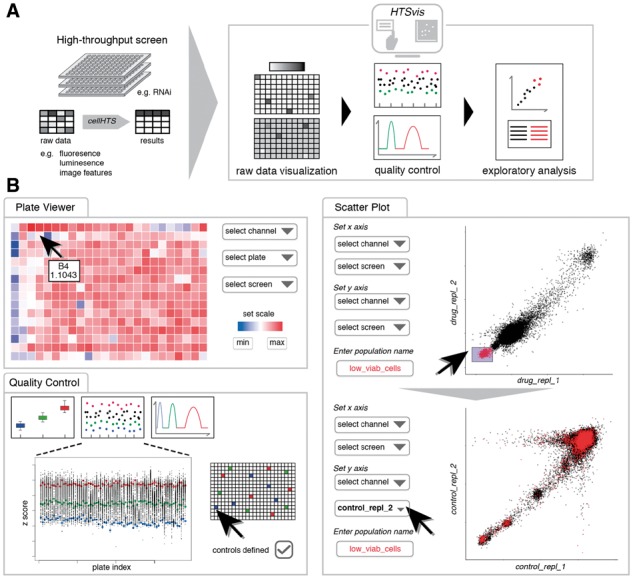
Fig. 1.

Workflow diagram and functionalities for visualization and exploratory data analysis of arrayed HTSs. (A) Raw data or statistically analyzed data of various assay formats, ranging from single-channel readouts to image features in 6- to 384-well plates, in tabular formats can be loaded into the application to facilitate interactive data visualizations. (B) The user can switch between four pages for performing, e.g. the identification of experimental artifacts (see plate viewer), perform quality control checks and the identification of hits by brushing and comparing measurements
