
Fig. 4.
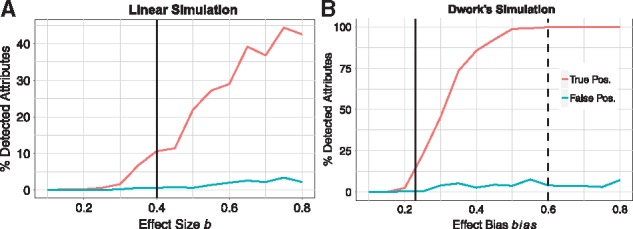
Result of a two-sample, unpaired t-test on simulated data using two simulation methods: Leek’s linear model (left panel) and Dwork’s experiment (right panel). Simulation parameters: 5000 attributes (500 functional) with 50 cases and 50 controls. Note the vertical scales are different. Each point represents the true positive rate (red) and false positive rate (blue) for a simulated data set with the effect size/bias given on the horizontal axis. The true and false percentages were computed based on an adjusted P-value of 0.05. The vertical dash line displays the effect bias used in Dwork’s simulation (). The vertical solid line displays the value of effect size we choose for the linear model simulation and its corresponding bias in Dwork’s simulation that yields the same detection power (∼ 12%) (Color version of this figure is available at Bioinformatics online.)