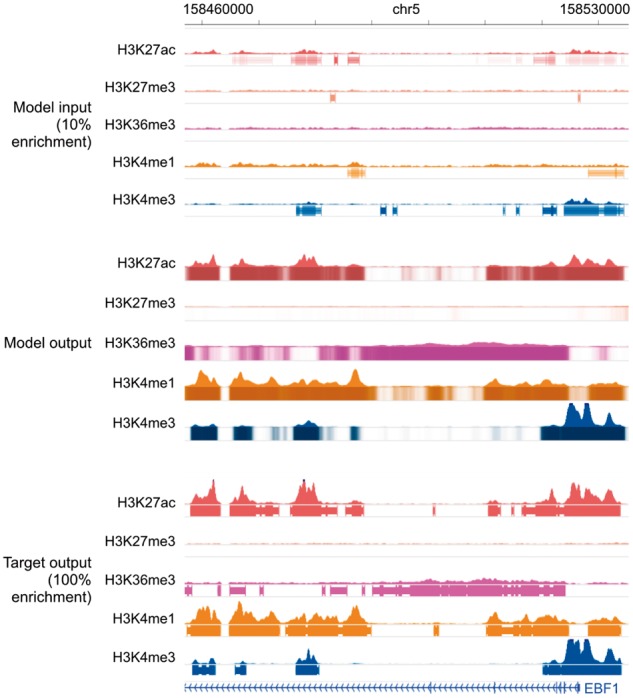
Fig. 6.

Genome browser tracks for low-enrichment ChIP-seq experiments. We compare noisy signal and peak calls obtained from the corrupted data with 10% enrichment (top) with Coda’s output (middle) and the target, high-quality signal and peak calls obtained from the uncorrupted data (bottom) at the EBF1 promoter. Coda significantly improves the signal-to-noise ratio and correctly calls the H3K27ac, H3K36me3, H3K4me1 and H3K4me3 peaks that were missed in the noisy data while removing a spurious H3K27me3 peak call. Note that we show the noisy peak calls to allow for comparisons; Coda uses only the noisy signal, not the peak calls, as input. The signal tracks are in arcsinh units, with the following y-axis scales: H3K27ac: 0–60, H3K27me3, H3K36me3 and H3K4me1: 0–40, H3K4me3: 100. The shading of the peak tracks that the model outputs represent the strength of the peak call on a scale of 0–1
