
Fig. 1.
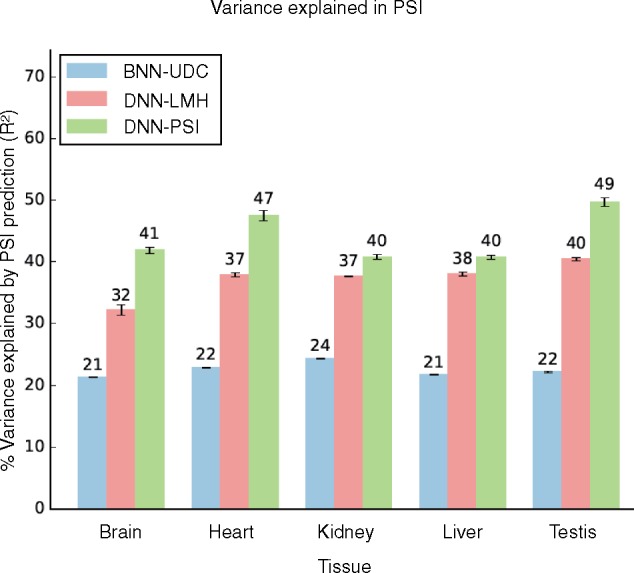
Improvement in percent variance explained by the new target function (green bars) compared to previous BNN (blue bars) and DNN (red bars) models on the tissue data used by (Leung et al., 2014)
Official websites use .gov
A
.gov website belongs to an official
government organization in the United States.
Secure .gov websites use HTTPS
A lock (
) or https:// means you've safely
connected to the .gov website. Share sensitive
information only on official, secure websites.
Improvement in percent variance explained by the new target function (green bars) compared to previous BNN (blue bars) and DNN (red bars) models on the tissue data used by (Leung et al., 2014)