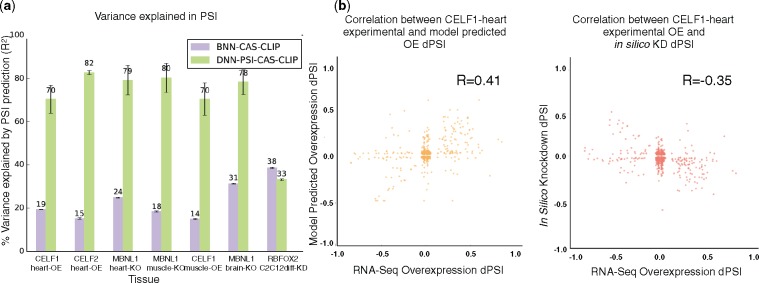
Fig. 4.
(a) Predicting the effect of splice factors. (a) Improvement in PSI prediction (% variance explained) for conditions involving splice factor KD/KO/OE, comparing BNN-UDC model with old target function (purple) to the new model (green). (b) Correlation scatter plots between predicted (y-axis) and measured (x-axis) dPSI for CELF1 Overexpression(OE) in mouse heart. Left, showing correlation to model predicted Overexpression dPSI. Right, showing correlation to in silico KD of CELF. (R: Pearson’s correlation coefficient, n = 2134 in both scatter plots)

