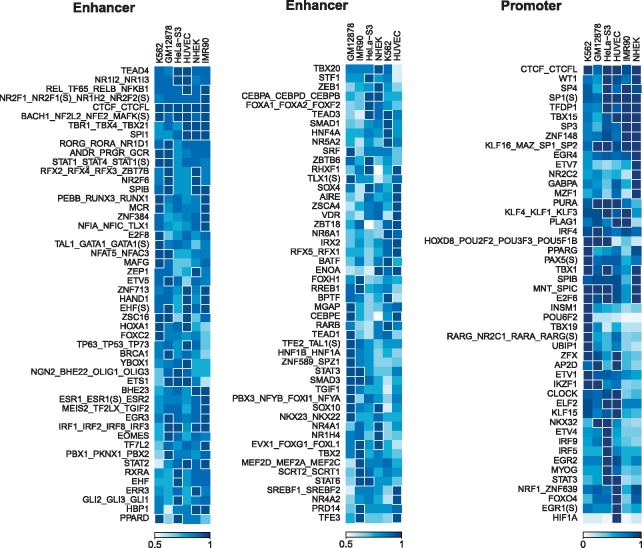
Fig. 3.
Estimated feature importance of motifs in PEP-Motif that have top 5% importance in at least one cell line. The feature importance is scaled between 0 (low importance) and 1 (high importance). Of the 503 motif representatives (427 single motifs and 76 motif clusters) found by PEP-Motif, 139 in enhancers and 48 in promoters have top 5% feature importance in at least one cell line. Here we display the top 100 of 139 predictive motif representatives in enhancers and all 48 predictive motif representatives in promoters. Each motif is represented by the name of its corresponding TF. If a TF has multiple associated motifs, alternative motifs are marked according to their identities in the database [e.g. EHF(S) denotes a single site motif of EHF (Kulakovskiy et al., 2016)]. If a motif represents a motif cluster, names of all the member motifs are shown in combination. We performed hierarchical clustering on both motifs (rows of the feature importance matrix) and cell types (columns) to have the motif features grouped. A cell is highlighted with white border if the corresponding motif has top 5% feature importance in the respective cell type

