
Fig. 2.
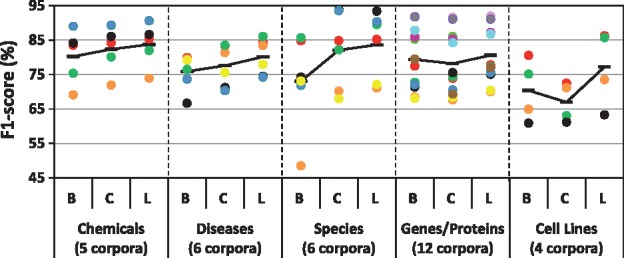
F1-scores of baseline (B), generic CRF (C) and generic LSTM-CRF (L) for five entity types, each measured within 4–12 corpora. The score for each corpus per entity type is depicted by a specific colored circle
Official websites use .gov
A
.gov website belongs to an official
government organization in the United States.
Secure .gov websites use HTTPS
A lock (
) or https:// means you've safely
connected to the .gov website. Share sensitive
information only on official, secure websites.
F1-scores of baseline (B), generic CRF (C) and generic LSTM-CRF (L) for five entity types, each measured within 4–12 corpora. The score for each corpus per entity type is depicted by a specific colored circle